Navigating the dynamic world of digital marketing demands more than just expertise; it requires building strong, trust-based relationships with your clients.
Regular client reporting is a key element of this trust. It showcases the tangible results of your efforts and reinforces your agency’s value.
However, it’s not an easy task. A client report breaks down KPIs, campaign performance metrics, insights into audience engagement, and actionable recommendations. You need specialized tools to gather all this information.
In this guide, we’ll delve into key features in reporting tools, present our top picks for client reporting software in 2025, and more.
Quick List of Best Client Reporting Software in 2025
- Databox: Provides real-time business analytics with customizable dashboards to track performance metrics from multiple data sources in one place.
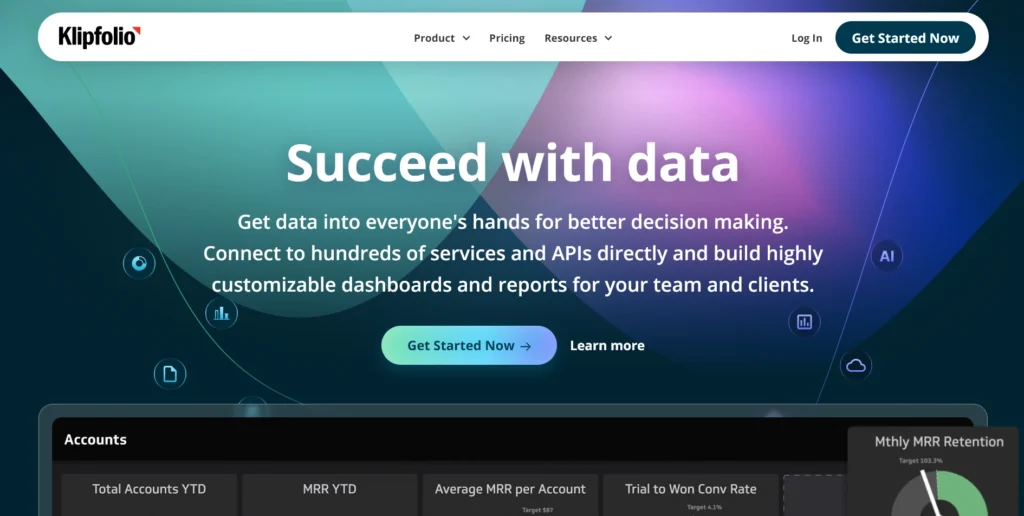
- Klipfolio: Offers real-time dashboard updates and sharing and creates interactive reports and visualizations from various data sources.
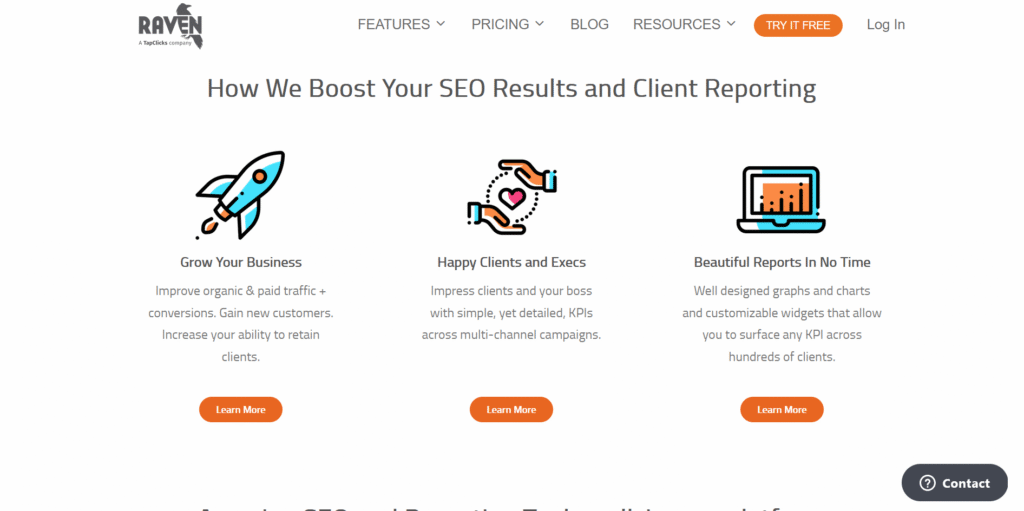
- RavenTools: Specializes in SEO and marketing reports, providing tools for keyword research, site audits, and backlink analysis.
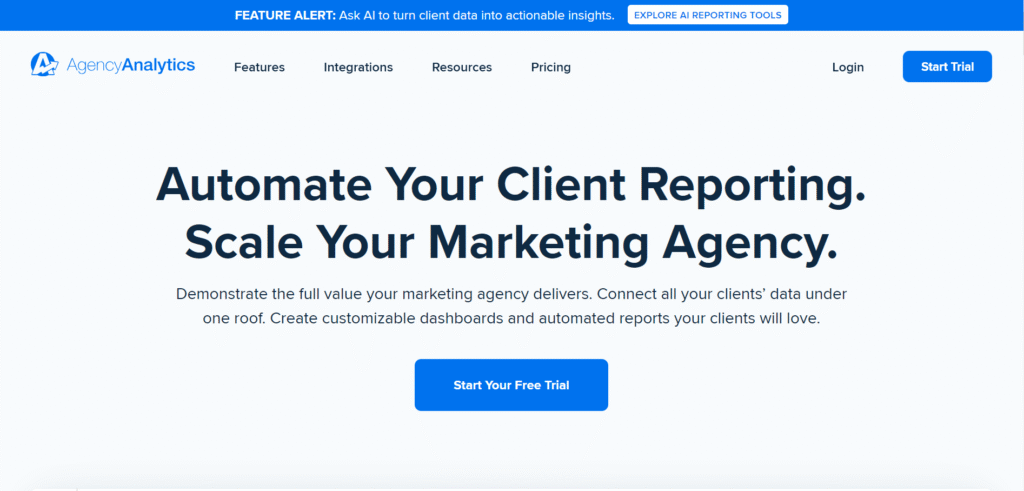
- AgencyAnalytics: Delivers comprehensive reporting features with white-label options, integrating with numerous marketing channels.
- Tableau: A leading data visualization tool with interactive and shareable dashboards, transforming raw data into actionable insights.
- Whatagraph: Simplifies the process of creating cross-channel reports with customizable templates.
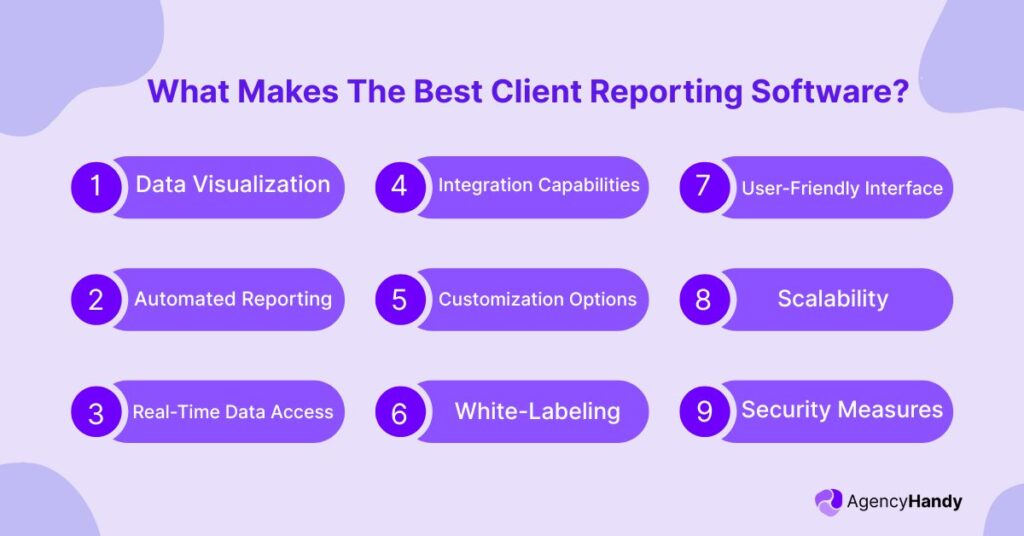
What Makes The Best Client Reporting Software?
How We Test, Evaluate & Select Apps
At Agency Handy, we are committed to providing our readers with accurate and unbiased evaluations of software applications. Our team of experienced professionals dedicates significant time to researching and testing each app, ensuring that we assess them in real-world scenarios relevant to their intended use. We maintain transparency in our methodologies and uphold strict editorial independence; we do not accept payments for app placements or for including links in our articles. This approach allows us to offer authentic and trustworthy recommendations, empowering our audience to make informed decisions about the tools they choose to enhance their productivity and workflows.
Selecting the ideal client reporting software is crucial for agencies aiming to deliver clear, insightful, and professional reports to their clients. The right tool not only enhances communication but also showcases the value of your services.
When evaluating client reporting software, consider the following key features:
- Data Visualization: Effective visualization tools, such as graphs and charts, transform complex data into easily understandable insights, aiding clients in grasping performance metrics quickly.
- Automated Reporting: Automation features enable the scheduling of regular reports, reducing manual effort and ensuring clients receive timely updates.
- Real-Time Data Access: Access to real-time data ensures that reports reflect the most current information, allowing for prompt decision-making and strategy adjustments.
- Integration Capabilities: Ensure the software seamlessly connects with various data sources such as Google Analytics, social media platforms, and CRM systems. This integration facilitates the automatic collection and consolidation of data, streamlining the reporting process.
- Customization Options: Opt for tools that offer customizable templates and dashboards. This flexibility allows you to tailor reports to each client’s specific needs, enhancing clarity and relevance.
- White-Labeling: White-label capabilities allow you to brand reports with your agency’s logo and colors, reinforcing brand identity and professionalism.
- User-Friendly Interface: A straightforward and intuitive interface ensures that both your team and clients can navigate the software with ease, improving overall user experience.
- Scalability: Choose software that can grow with your agency, accommodating an increasing number of clients and expanding data needs without compromising performance.
- Security Measures: Robust security features are essential to protect sensitive client data, ensuring compliance with data protection regulations and maintaining client trust.
What’s Not Included in This Roundup?
In this roundup, we’ve focused on versatile client reporting tools that cater to a broad range of industries and use cases. Consequently, we’ve excluded software solutions that are:
Niche Applications: Tools designed exclusively for specialized industries or unique use cases may not offer the versatility required by a diverse clientele.
Unsupported Platforms: Software lacking regular updates, active support, or compatibility with current operating systems can pose security risks and operational challenges.
The Best Client Reporting Software at a Glance
Here’s a quick comparison of our top picks for client reporting:
| Software Name | Best For | Standout Feature | Pricing |
| Databox | Real-time performance tracking | Centralized platform for all your KPIs | Free plan available; paid plans from $47/month |
| Klipfolio | Real-time dashboard updates and sharing | Interactive dashboards with real-time data | Starting at $80/month |
| RavenTools | SEO-focused marketing agencies | Advanced SEO audit tools | Starting at $39/month |
| AgencyAnalytics | Marketing agencies seeking comprehensive reporting | Customizable dashboards and automated reports | Starting at $59/month |
| Tableau | Advanced data visualization capabilities | Complex data analysis with interactive visuals | Starting at $11/user/month |
| Whatagraph | Cross-channel reporting | Simplifies complex data into engaging reports | Custom pricing |
Best Client Reporting Software to Measure Your Service Impact
Here’s a roundup of the best platforms to step up your client reporting game. We delve into pros, cons, detailed features, and pricing.
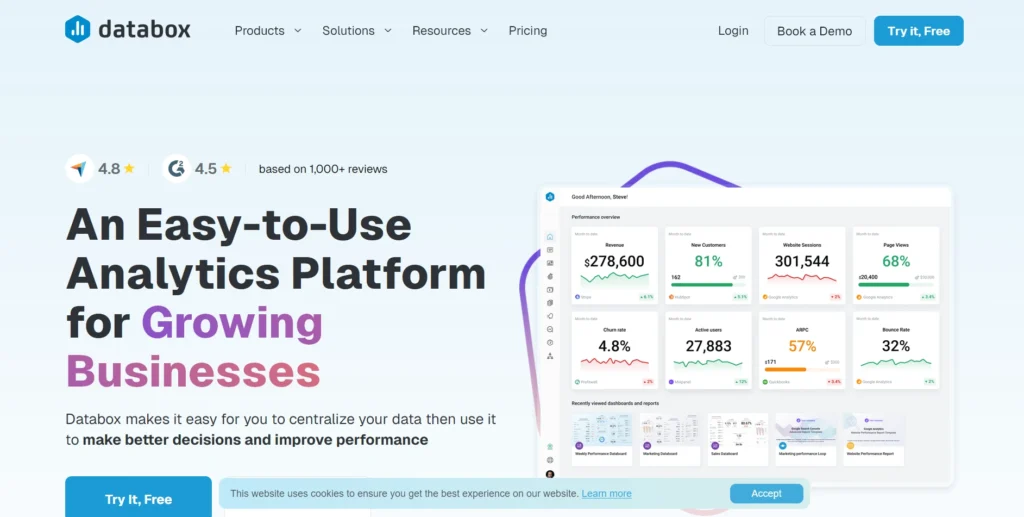
1. Databox (Web, iOS, Android)
Databox Pros
- Drag-and-drop interface, no coding required.
- Notification alerts when client metrics fall below thresholds.
- SQL, REST APIs, and Zapier integrations
- Mobile-friendly platform
- Thousands of pre-made metrics and templates
Databox Cons
- Real-time sync issues with data sources such as Google Analytics.
- Limited direct integrations
Databox is a powerful and mobile-friendly analytics platform designed to simplify client reporting and data management. It helps businesses and agencies centralize data effortlessly from various sources, including software tools, databases, APIs, and spreadsheets.
With its drag-and-drop dashboard builder, you can create customized, visually appealing dashboards without needing coding expertise. This makes tracking key performance indicators (KPIs) across marketing, sales, and operational areas not only easy but enjoyable.
The platform offers a vast Metric Library filled with pre-built metrics and templates to help you save time and start analyzing critical data faster.
If you’re managing multiple clients, the Scorecard Automation feature is a real lifesaver. It automates report generation and distribution daily, weekly, or monthly. Plus, timely notifications alert you when performance metrics fall below thresholds, so you can stay proactive and on top of your goals.
You’ll love its flexibility, with over 70 native integrations, including tools like HubSpot, Facebook Ads, and Excel, as well as custom API connections.
For those who need to monitor progress on the go, the platform’s mobile-ready dashboards provide seamless access anytime, anywhere.
By combining data into one engaging platform, this tool helps decision-making and simplifies client reporting, saving your valuable time. Whether you’re managing e-commerce sales, ad campaigns, or operational KPIs, it’s a reliable companion to help you achieve your goals with confidence.
Databox Pricing:
- Free Forever: $0/month or annually, includes 3 data sources, 3 users, daily updates, and 3 dashboards.
- Starter: $59/month (billed monthly) or $47/month (billed annually); 3 data sources, 5 users, 4-hour updates, unlimited dashboards. Extra data sources at $5.60 each.
- Professional: $199/month (billed monthly) or $159/month (billed annually); 3 data sources, unlimited users, hourly updates, unlimited dashboards, 24 months of historical data. Extra data sources at $5.60 each.
- Growth: $399/month (billed monthly) or $319/month (billed annually); 3 data sources, unlimited users, hourly updates, unlimited dashboards, unlimited historical data. Extra data sources at $5.60 each.
- Premium: Custom pricing; 100 data sources, 15-minute sync for 5 sources, advanced security, near real-time monitoring, priority support, enterprise-level security.
2. Klipfolio (Web, iOS, Android)
Klipfolio Pros:
- Highly customizable, visually appealing dashboards
- Supports real-time and automated reporting
- Integrates with multiple data sources (Google Analytics, MailChimp, Shopify, etc.)
- Prebuilt templates for faster dashboard setup
- Flexible sharing via email or web
Klipfolio Cons:
- Knowledge base needs better organization
- Requires technical skills for complex setups
Klipfolio is a versatile and user-friendly dashboard platform that empowers you to connect to hundreds of services and APIs directly, enabling the creation of highly customizable dashboards and reports for your team and clients. citeturn0search0
With its intuitive drag-and-drop interface, you can effortlessly design dashboards that visualize your key performance indicators (KPIs) in real time, making data-driven decisions a breeze.
One of the standout features of Klipfolio is its extensive integration capabilities. You can pull data from marketing tools like Google Analytics and Facebook Ads. Klipfolio also supports spreadsheets from Excel and Google Sheets.
If you’re working with databases, it integrates seamlessly with MySQL, PostgreSQL, and more. This flexibility brings all your data into one place effortlessly.
To make your reporting even more efficient, Klipfolio offers a rich library of pre-built metrics and templates. These resources allow you to quickly set up dashboards fit for various business functions, including marketing, sales, and finance.
If you prefer a more personalized touch, you can create custom metrics using their PowerMetrics feature. It gives you the freedom to track what’s most important to your organization.
Moreover, sharing insights with your team or clients is straightforward with Klipfolio. You can distribute dashboards via email, export them as PDFs, or publish them as web pages.
However, some users have noted that there is a learning curve, especially for those without technical backgrounds. In contrast, Databox has a gentler learning curve with its intuitive drag-and-drop interface and pre-built templates.
In summary, Klipfolio is a powerful tool that brings your data to life through interactive and customizable dashboards that may take some time to master.
Klipfolio Pricing:
- Free Plan: $0/month; basic dashboards, manual updates, and limited features for individuals exploring analytics.
- Standard Plan: $60/month (billed annually); real-time syncing, custom dashboards, templates, and email/PDF sharing for SMBs.
- Custom Plan: custom pricing; advanced integrations, PowerMetrics, and enterprise support for larger businesses.
3. RavenTools (Web)
RavenTools Pros:
- Fully white-labeled reports for branding
- Integrates with over 30 platforms seamlessly
- Customizable dashboards with drag-and-drop
- Automates reports for various marketing metrics
- Excellent customer support for quick help
RavenTools Cons:
- The keyword ranking system is complex
- Occasional syncing issues with data
Raven Tools is your go-to marketing reporting platform if you’re an agency looking to simplify and elevate client reporting.
With its drag-and-drop interface, creating visually stunning, white-labeled reports is effortless. Your clients will see beautifully branded documents that showcase your hard work, reinforcing your professional image.
If SEO is your focus, Raven Tools truly shines. It’s packed with built-in tools to track rankings, monitor backlinks, analyze organic traffic, and conduct SEO audits.
You can pull data from trusted sources like Google Analytics, Moz, Bing, Majestic, and more. Also, you can even upload spreadsheets with custom keyword lists to create targeted insights.
Automation is another feature you’ll love. You can schedule reports daily, weekly, or monthly and share them however you prefer; email, PDF, or even an HTML link.
Although both RavenTools and Klipfolio have drag-and-drop interfaces, they serve different strengths.
Raven Tools excels in SEO-specific features, simplifying complex data like rankings and backlinks into digestible formats. In contrast, Klipfolio features broader data visualization with highly customizable dashboards and real-time tracking across various business functions.
Overall, while there’s a slight learning curve with Raven Tools’ advanced features, it’s a highly effective and affordable option for agencies centered on SEO. Its white-label capabilities and flexibility in reporting make it a powerful tool.
RavenTools Pricing:
- Small Biz: $49/month (billed monthly) or $39/month (billed annually); includes 2 users, 2 campaigns/domains, and 1,500 rank position checks per month.
- Start: $109/month (billed monthly) or $79/month (billed annually); offers 4 users, 20 campaigns/domains, and 15,000 rank position checks per month.
- Grow: $199/month (billed monthly) or $139/month (billed annually); provides 8 users, 80 campaigns/domains, and 20,000 rank position checks per month.
- Thrive: $299/month (billed monthly) or $249/month (billed annually); includes 20 users, 160 campaigns/domains, and 25,000 rank position checks per month.
- Lead: $479/month (billed monthly) or $399/month (billed annually); offers 40 users, 320 campaigns/domains, and 30,000 rank position checks per month.
4. AgencyAnalytics (Web)
AgencyAnalytics Pros:
- Integrates with over 80 data sources.
- Fully white-labeled reports for branding.
- Automates client reporting, saving time.
- Customizable dashboards for client insights.
- Provides comprehensive marketing KPI overviews.
AgencyAnalytics Cons:
- Pricing may be steep for startups.
- Widget customization has some limitations.
Managing multiple clients and platforms can be overwhelming, but AgencyAnalytics makes it a breeze.
Built specifically for marketing agencies, this platform connects seamlessly to over 80 tools, including SEO, PPC, social media, email marketing, and call tracking. Bringing all your data into one place, helps you create clear, value-packed reports and dashboards that keep your clients in the loop.
One of the platform’s standout features is its smart use of AI. Tools like “Ask AI” and automated summaries analyze your data in seconds, highlighting trends and uncovering growth opportunities.
This means you can spend less time crunching numbers and more time delivering actionable insights that impress your clients.
Customizing reports has never been easier. With its drag-and-drop editor and advanced filtering options, you can tailor every report to focus on the metrics that matter most.
Plus, the fully white-labeled design ensures your branding takes center stage, giving your reports a polished, professional touch.
AgencyAnalytics also helps you stay proactive with features like goal tracking and real-time alerts. Whether you’re hitting a milestone or spotting a dip in performance, the platform keeps you informed so you can respond quickly and effectively.
What sets the platform apart is its balance of simplicity and power. Its intuitive interface ensures that even complex tasks feel manageable, while responsive customer support is always there to help.
AgencyAnalytics Pricing:
- Launch: $79/month (billed monthly) or $59/month (billed annually), Includes 5 client campaigns, Unlimited reports, report scheduling, 80+ integrations, client portal access, and basic branding.
- Grow: $239/month (billed monthly) or $179/month (billed annually), Includes 10 client campaigns, AI insights, metric alerts, goal tracking, ad spend markup, and full branding.
- Perform: $479/month (billed monthly) or $349/month (billed annually), Includes 15 client campaigns, benchmark comparisons, trend forecasting, anomaly detection, data aggregation, and priority support.
5. Tableau (Windows, Mac, Web, iOS, Android)
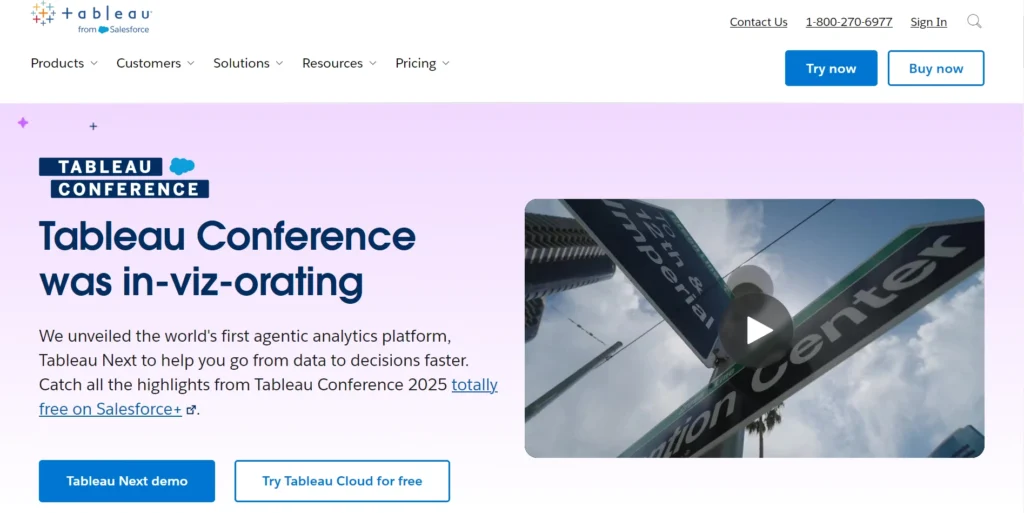
Tableau Pros
- Supports real-time insights and KPIs
- Strong security ensures client data safety
- Handles large datasets with enterprise efficiency
- Highly customizable dashboards for client needs
- Offers actionable insights with advanced analytics
Tableau Cons
- limited customization in timing or frequency of scheduling
- Manual data updates are needed occasionally
When it comes to transforming raw data into meaningful insights, Tableau is in a league of its own. Packed with innovative features, this platform revolutionizes how businesses analyze, share, and act on data.
Its standout AI capabilities go beyond basic analytics, providing predictive insights and recommendations give your business an edge.
If you’re a Salesforce user, Tableau is a natural choice. Since its acquisition by Salesforce in 2019, the platform offers deep integration with tools like Einstein Copilot, delivering seamless, real-time insights directly into your workflows.
Flexibility is key with Tableau, seamlessly connecting to spreadsheets, cloud platforms, and large data warehouses. Its embedded analytics can integrate into custom applications or web portals, ensuring insights are accessible.
With top-tier security certifications like SOCII, ISO, and HIPAA compliance, it ensures that your data remains protected, even in large-scale deployments.
For innovators, this software offers powerful developer tools and APIs for advanced modeling and custom dashboards. With support from a global community of over a million users, resources and inspiration are always at your fingertips.
Overall, from small agencies to enterprises, Tableau empowers organizations to scale analytics, make informed decisions, and embrace a data-driven culture
Tableau Pricing:
- Enterprise Creator: $115/user/month (billed annually); includes Tableau Desktop, Prep Builder, and Cloud/Server Creator license.
- Enterprise Explorer: $70/user/month (billed annually); offers self-service analytics with Explorer license and management tools.
- Enterprise Viewer: $35/user/month (billed annually); enables dashboard viewing with management features.
6. Whatagraph (Web)
Whatagraph Pros
- Simplifies performance tracking with pre-made widgets
- Combines cross-channel data for unified insights
- Automates reporting to save valuable time
- Offers intuitive drag-and-drop visualization tools
- Supports native integrations and custom APIs
Whatagraph Cons
- Custom module creation can feel restrictive
- Limited functionality in basic plan offerings
Whatagraph is a marketing performance and reporting platform designed to transform scattered data into clear, actionable insights.
Known for its simplicity and efficiency, the platform integrates with over 50 marketing tools. It includes Google Ads, Facebook, and Shopify, making it easy to consolidate cross-channel data into one cohesive dashboard.
Whether you’re managing campaigns, tracking KPIs, or creating reports, Whatagraph’s intuitive drag-and-drop interface ensures you can visualize it all.
The platform’s standout features include automated reporting, advanced data grouping, and custom calculations. It also allows users to blend data from multiple sources, enabling them to generate aggregated metrics or analyze trends at scale.
Reports can be personalized to fit specific needs, thanks to customizable widgets, templates, and pre-made charts. Agencies can even integrate Whatagraph with Google BigQuery for streamlined data storage and advanced analytics.
For organizations prioritizing simplicity, it excels at reducing manual tasks. Users can set up automated data flows to warehouses or live dashboards. It ensures stakeholders have real-time access to insights without tedious updates.
Compared to Tableau, Whatagraph shines in ease of use for marketing-specific data and has an intuitive reporting system. But Tableau offers advanced analytics and deep data exploration. However, it often requires technical expertise.
Overall, if you’re looking to streamline data management and reporting, Whatagraph transforms marketing performance into clear, actionable results.
Wrapping Up
Client reporting is vital for showcasing value and building trust in digital marketing. Tools like Databox, Whatagraph, and Tableau streamline data visualization, reporting, and sharing, helping agencies focus on strategy over manual tasks.
The right choice depends on your needs, whether it’s ease of use, scalability, or advanced analytics. Simplify your reporting process and boost client satisfaction by leveraging the best platform for your agency’s goals.
FAQs
Can I customize report templates in most client reporting tools?
Yes, many tools like Whatagraph and Tableau offer customizable templates. You can tailor metrics, visuals, and branding to match client requirements, ensuring reports are professional and aligned with your agency’s identity.
Do these platforms support real-time data updates?
Most tools, such as Databox and Tableau, offer real-time data updates. This ensures reports reflect the latest performance metrics, allowing for timely decision-making.
Are client reporting tools suitable for small agencies?
Absolutely! Platforms like RavenTools and AgencyAnalytics are ideal for small agencies. They offer affordable pricing plans, ease of use, and essential features to streamline reporting without requiring extensive technical expertise.
How secure are client reporting tools?
Leading platforms prioritize security with features like encryption, access controls, and compliance with standards like ISO and SOCII. Tools like Tableau also offer enterprise-grade security, ensuring sensitive client data is well-protected.
Can these tools integrate with CRM software?
Yes, many tools, including Whatagraph and AgencyAnalytics, integrate with CRM platforms like HubSpot and Salesforce. This simplifies data collection, enhances report accuracy, and ensures seamless workflows for client relationship management.